
Dashboard Overview
The Dashboard provides a comprehensive visual overview of your business. This includes critical metrics such as opportunities, pipeline value, and conversion rates, giving you valuable insights into your business's current status and future trajectory.
As you navigate the Dashboard, various tiles will display essential information about your business operations, customer movement through pipelines, Google Ads performance, Google My Business page activity, and tasks assigned to team members. These tiles can be customized to your preference by creating a personalized dashboard.
Note: Access to certain components may be restricted based on your user permissions.
Dashboard Management
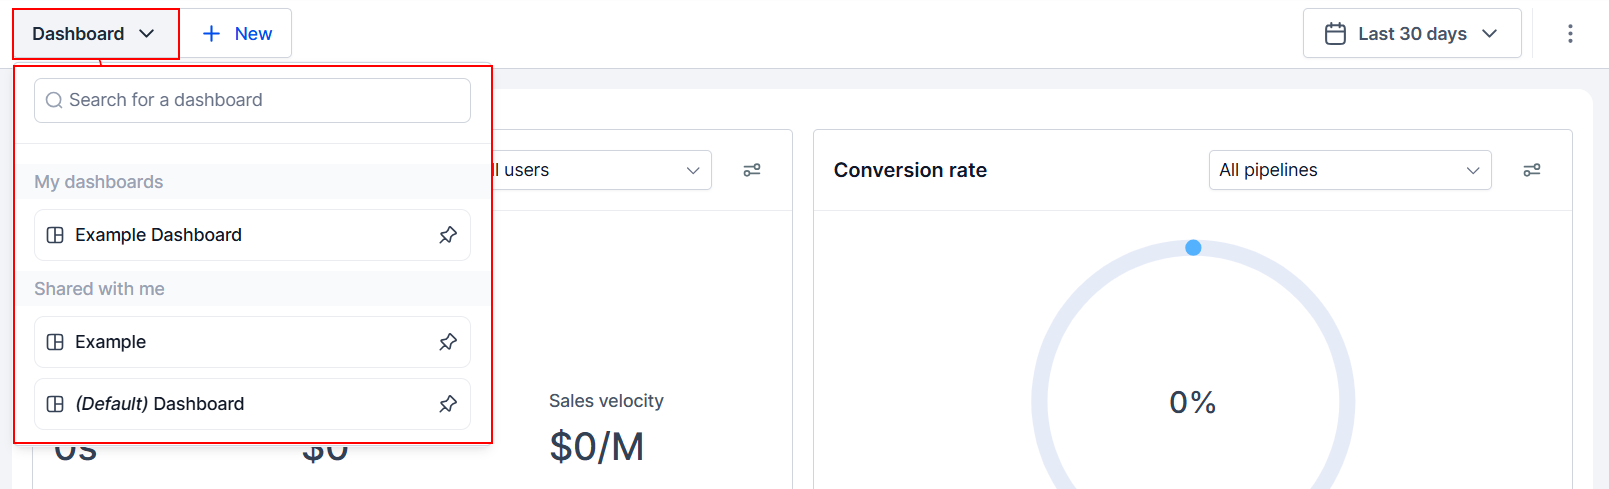
Dashboard Switch
Toggle between available dashboards or add new ones to your system.
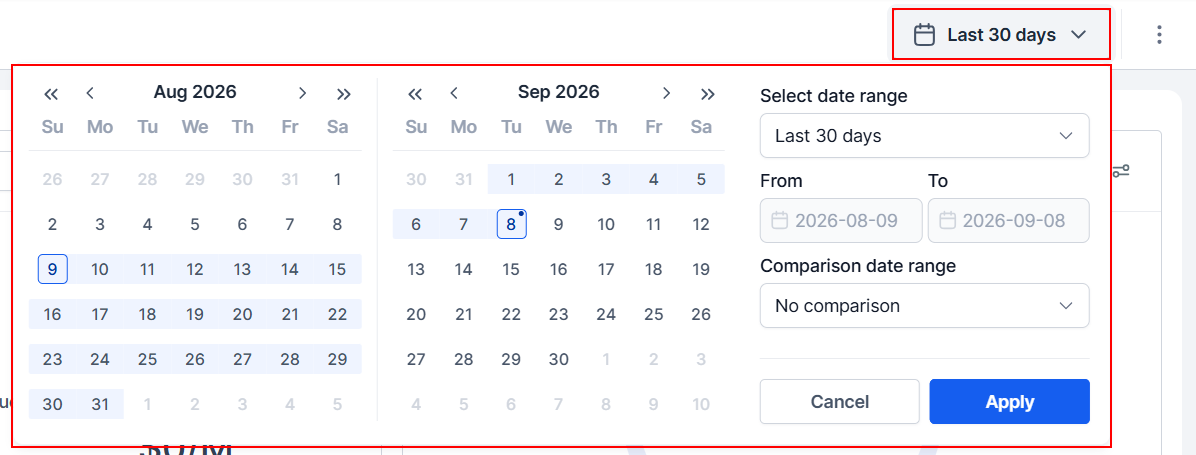
Time Frame
This section allows you to change the time frame for the data shown on the widgets.
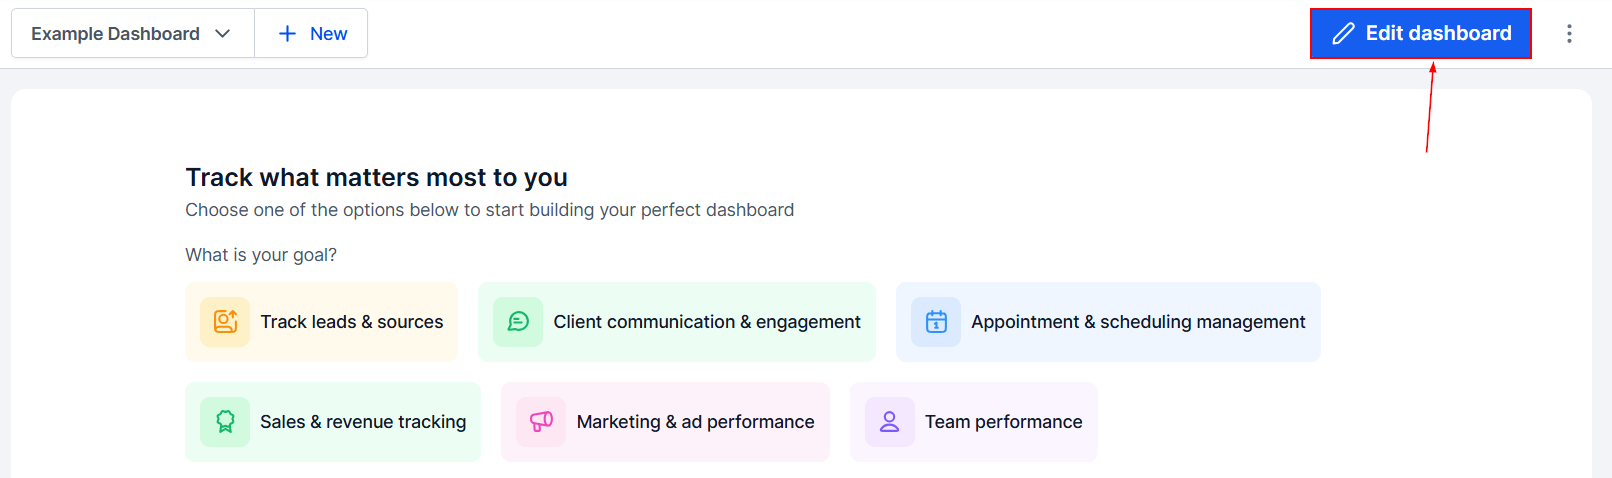
Customize Dashboard
For dashboards you have created, click on the Edit Dashboard button to customize it. You can add, remove, and reorganize widgets after creating your custom Dashboard.
Check out some of our articles on customizing the Dashboard to learn more about the available widgets and Objects!
Selecting a Time Zone
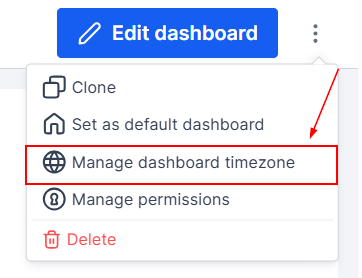
You can switch between time zones by going to the top right corner and clicking the three dots.
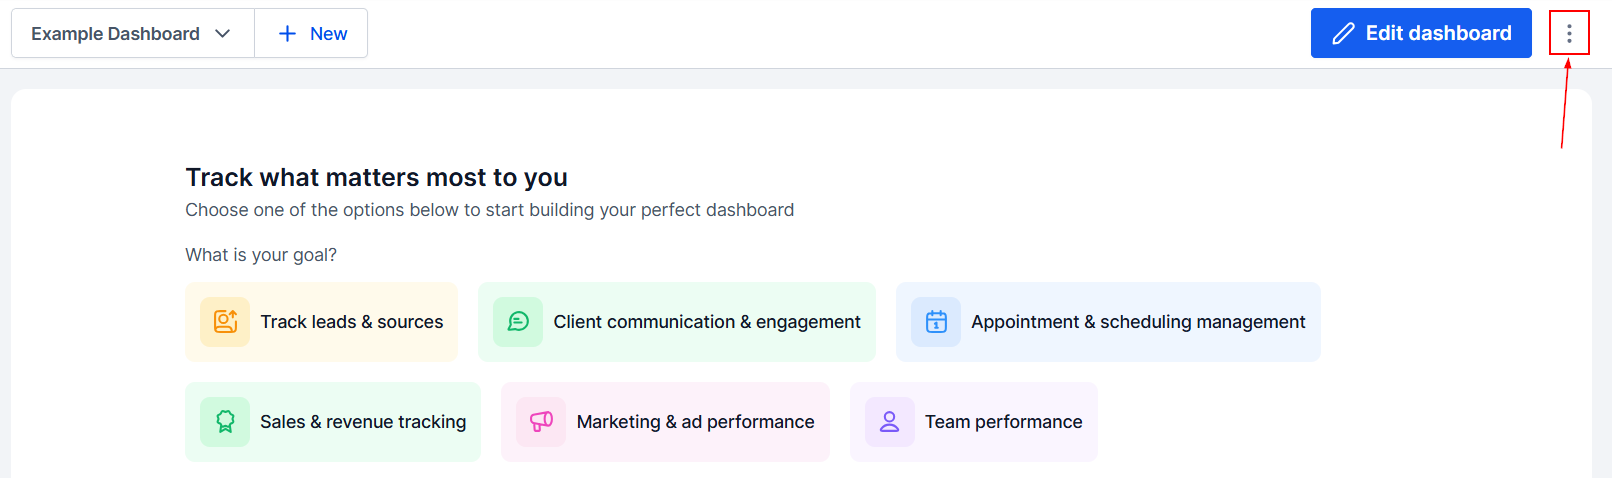
This will give you the option to manage the Dashboard Time zone.
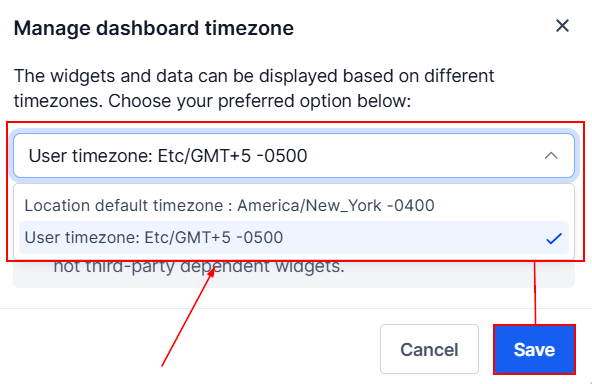
Here you can switch between the location's time zone and your own. If you view more than one dashboard, the selected time zone will be applied to all.
Quick Filters
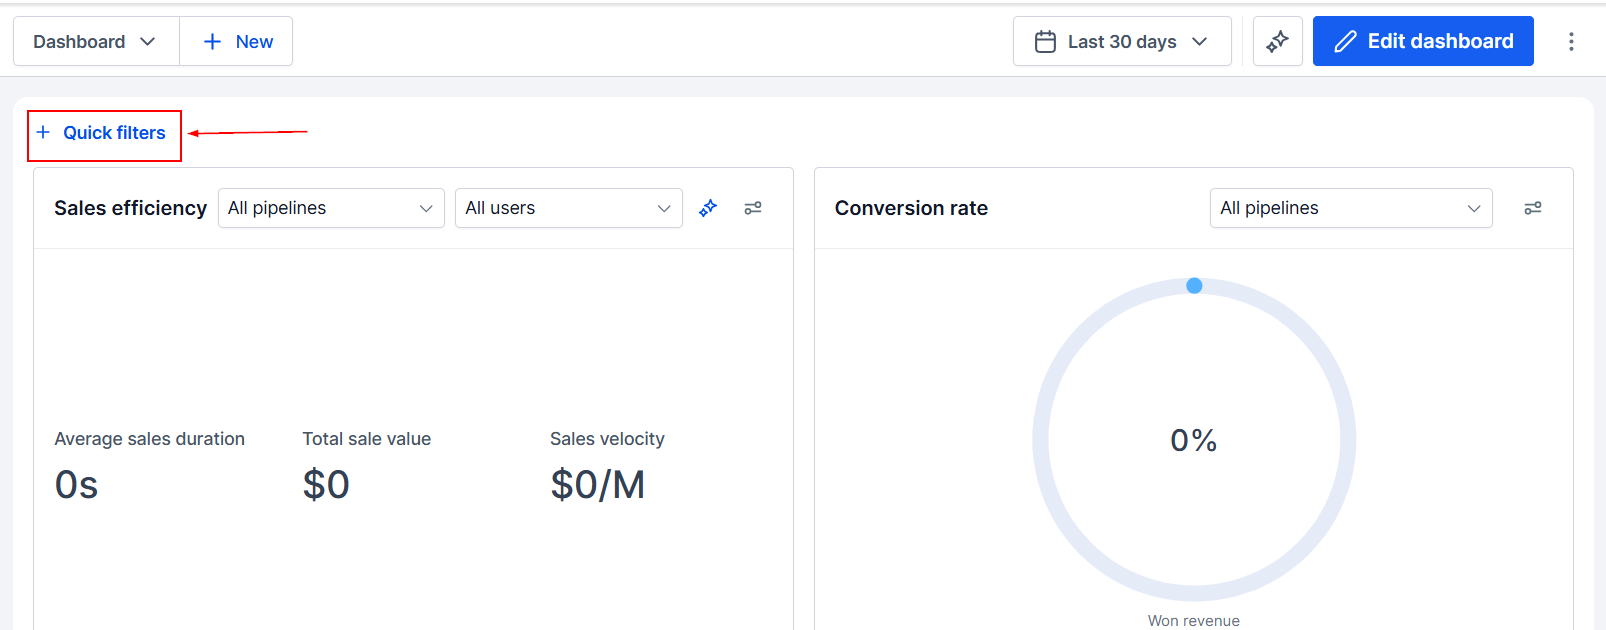
Once you have added widgets, you can apply conditions to the data shown for refined results.
Dashboard Data Tiles
The Dashboard offers a summary of your CRM performance. Each data tile provides specific insights that can help enhance your business success, including views of opportunities, pipeline value, and conversion rates. Some of the most common Tiles are:
Sales Efficiency
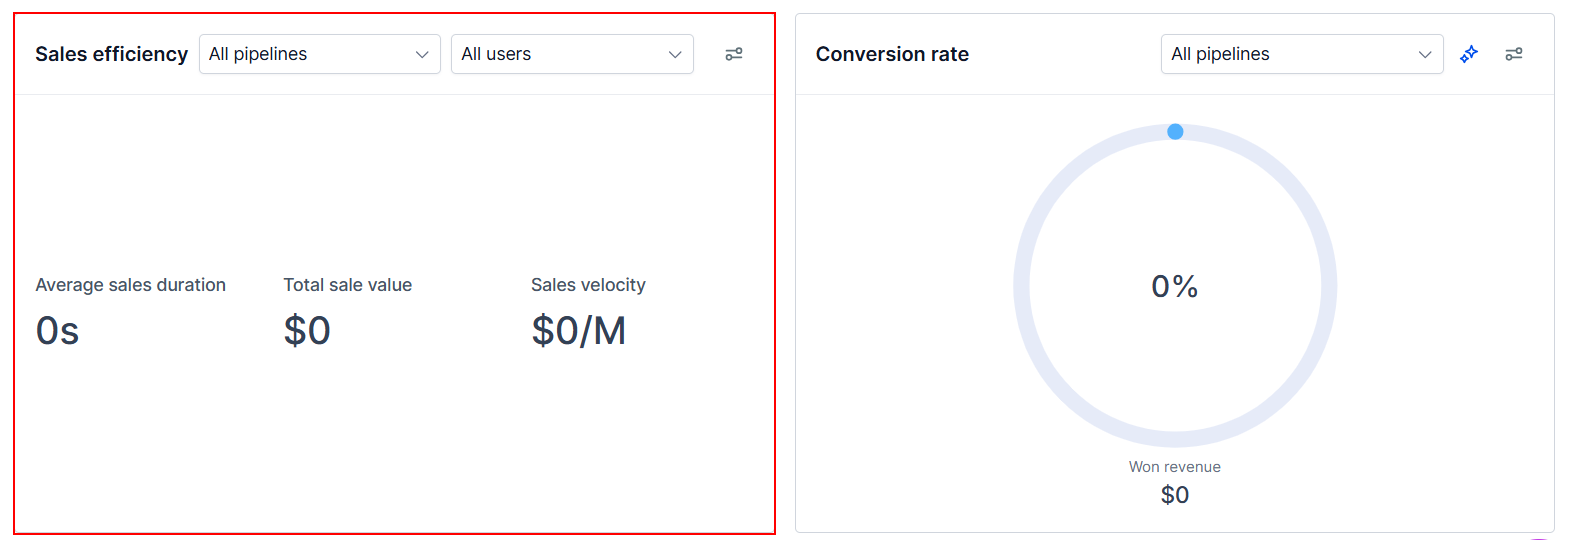
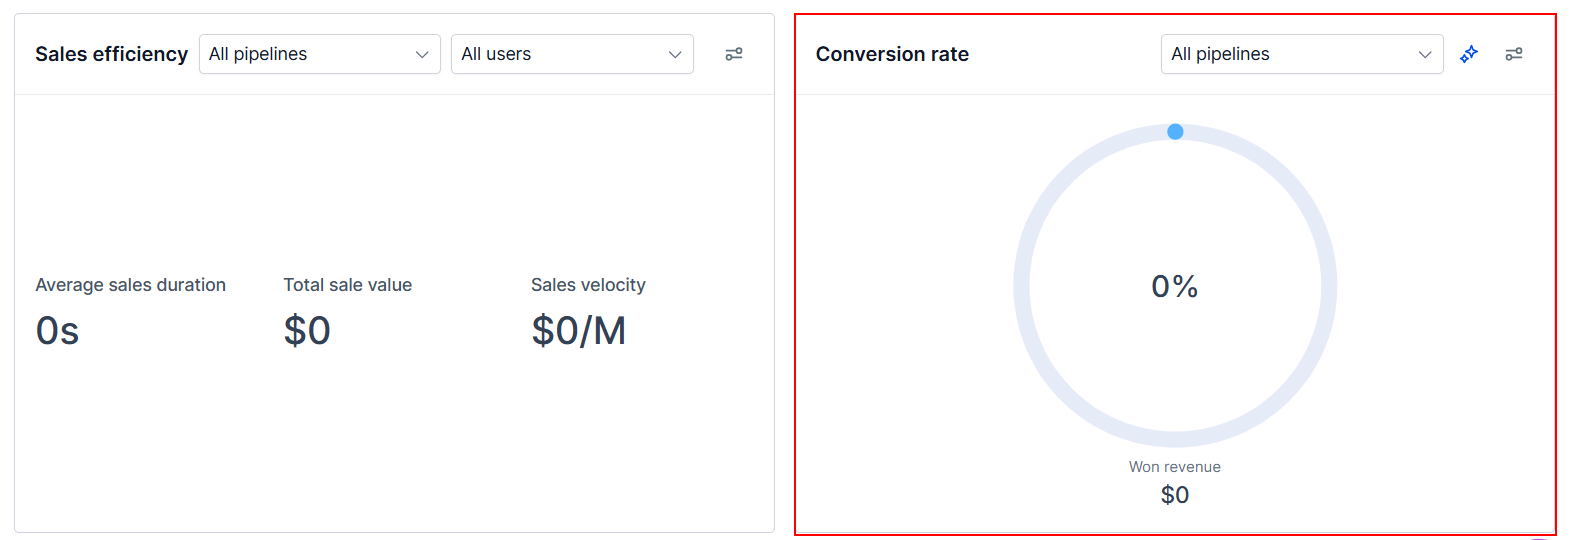
The Sales Efficiency widget helps track three key sales metrics: average sales duration, total sales value, and sales velocity, giving you a quick view of sales performance. The metrics can be filtered by users, allowing you to evaluate and optimize salesperson performance more precisely. You can also filter by pipeline to analyze the efficiency of a specific sales process rather than your entire sales operation.
Conversion Rate
The Conversion Rate tile provides insights into the health of your business by comparing won leads to total pipeline leads. Customize date ranges to analyze lead conversion rates over specific periods.
Funnel
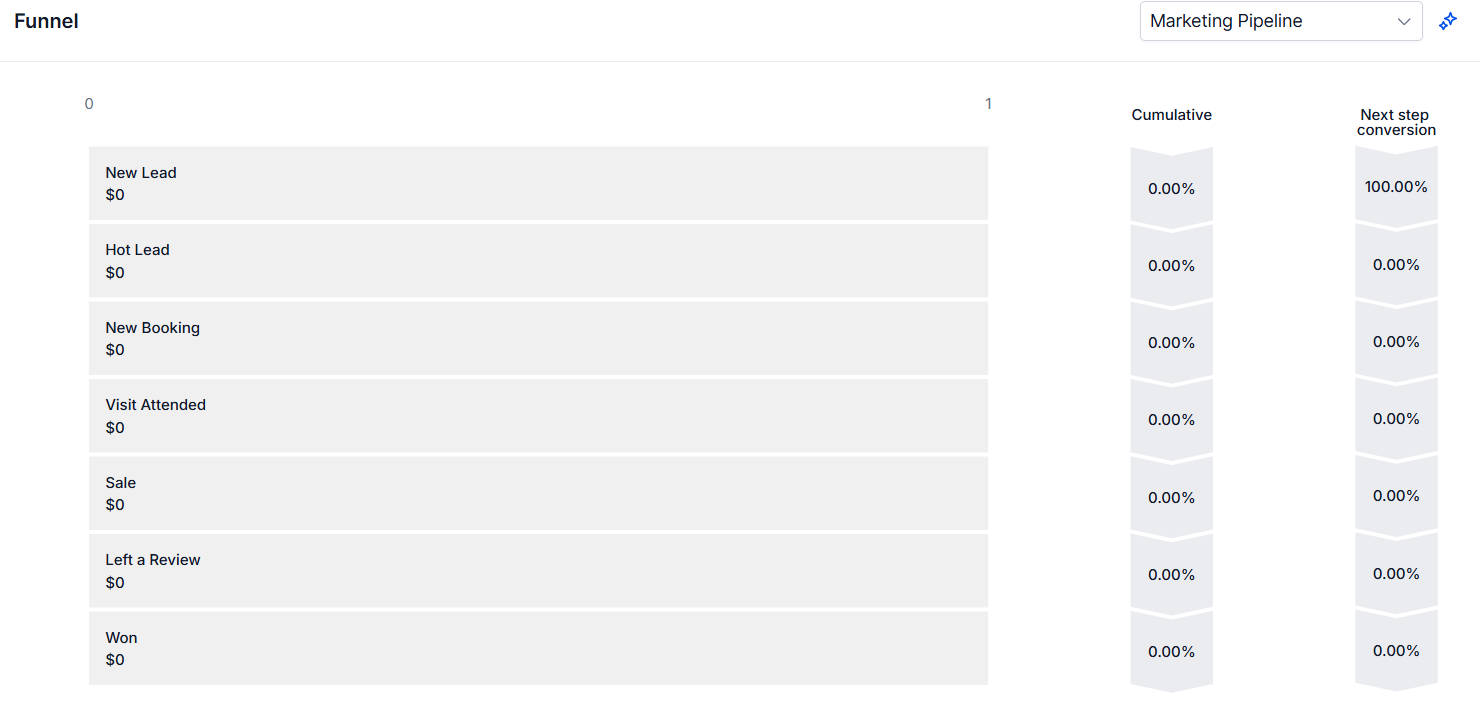
The Funnel visualization outlines the journey of opportunities through your pipelines. Select a pipeline and configure the date range to view the number of leads, total value, and percentage of leads at each stage.
Now you're ready to run through your dashboard every time you log in to your account and gain handy insights into your business!